

“Knowledge speaks, but wisdom listens,” said legendary guitarist Jimi Hendrix—a fitting reminder as we reflect on the wild ride that has been the first half of 2025. It turns out we were quite serious when we discussed the likely virulent swings in policy rhetoric out of Washington and the associated turbulence in stock price activity. That’s exactly what investors have experienced as we approach the close of 2025’s first six months.
Let’s review. The market has shown surprising resilience, weathering the shift from early hopes of accelerated growth—driven by talk of deregulation and fiscal stimulus under the new White House administration—to fears that the president’s proposed triple-digit tariffs could trigger surging inflation and weak economic growth, raising concerns about the dreaded ‘S’ word: stagflation.
The Market’s Tariff Time-Out
The subsequent tariff time-out (TTO), announced by the president on April 8, halted a market decline that had reached nearly 20% and stopped the swift surge in Treasury rates that was beginning to intimidate even the bravest stock and bond investors. In fact, the TTO inspired a rally of nearly 12% from April 8th through April 301, effectively erasing the significant paper losses from the month’s early days. As a result, April ended virtually flat, despite the market’s roller-coaster ride.
Apparently, U.S. Treasury Secretary Scott Bessent—a longtime expert in the fixed-income markets—convinced the president that financial markets could unravel in dangerous fashion if he didn’t quickly pause the planned escalation of tariff duties on key foreign trading partners. At least, that’s what the sharp post–“liberation day” decline in stock and bond prices appeared to signal, to both the head of the Treasury and close market followers in general.
What the Data Shows
These market concerns were reflected across nearly all confidence-related economic and investor surveys, commonly referred to as soft data. Notably, there were significant declines in consumer and CEO confidence, small business optimism, and investor sentiment. These metrics plummeted as the erratic delivery of tariff threats continued in unpredictable waves. As a result, the S&P 500’s forward price-to-earnings ratio fell sharply from a peak of about 22.5 times in mid-February to 18 times earnings during the spring “liberation day” announcement period2. P/E levels are largely driven by market psychology: when confidence is high, they rise and soar; when it’s diminished, they recede, sometimes meaningfully.
We believe it is critically important to note that, contrary to the weak trends in the soft data, the hard data—key items such as real GDP growth, earnings, employment, consumer spending and business investment—have for the most part held up quite well. That’s what supports our continued constructive stance on the market.
The key questions now are: Will the concerning drop in confidence and related stagflation fears eventually turn into reality if the disputes are not resolved soon? Or, is our economy strong enough—and an adequate number of other positive offsets surface (e.g., proposed tax cuts, possible fed rate cuts, etc.)—to absorb these larger-than-anticipated tariff policy-driven headwinds?
Some Improvement in Trend Supports Rally
More recent news flow suggests that the temporary pause on tariffs has helped ease consumer and investor skepticism. The TTO-driven rally that began in April extended into May, with the S&P 500 rising another 6.3% during the month known for blooming flowers.3
This brings the cumulative S&P 500 advance from the April 8 low to about 19%, nudging the market back into slightly positive territory for the year.4 On Dec. 31, 2024, the S&P 500 closed at 5,881. As of May 31, 2025, it sits at 5,911.
Despite all the angst, the market returned to just slightly above where it began the year. Fascinating, isn’t it? This comes in the face of extreme volatility, talk of bear market-level selloffs, renewed bull market recoveries, and wide-ranging adjustments in investment strategists’ S&P 500 targets (depicted in the tables below).
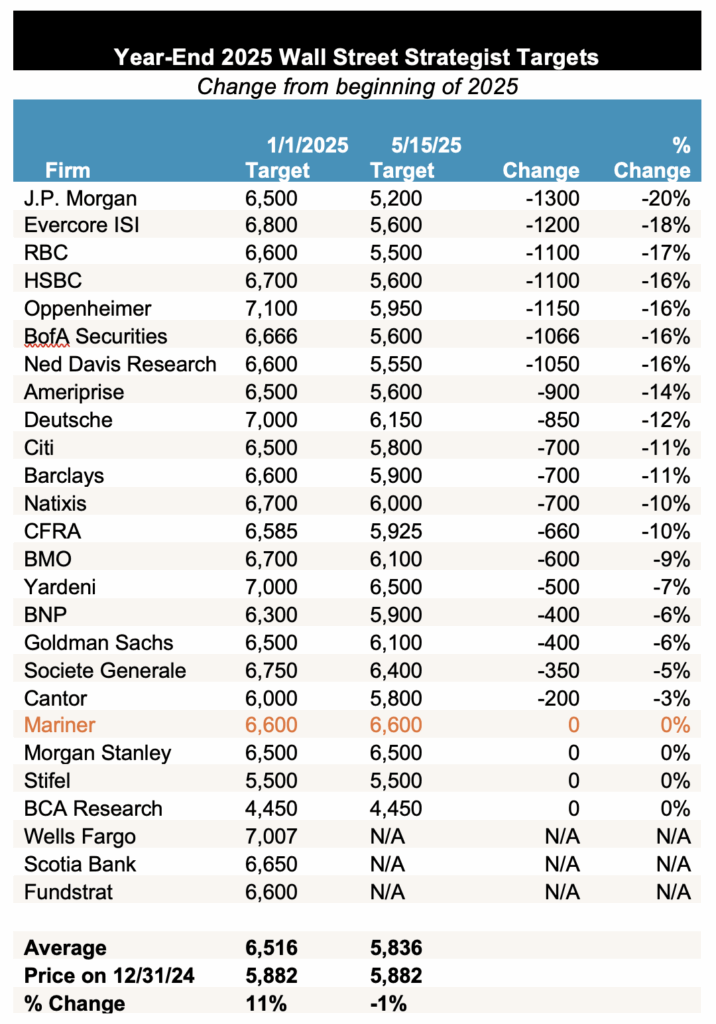
Source: Data sourced from Strategas, 5/15/2025
Many of these strategists shifted from optimistic forecasts on Jan. 1 to notably bearish outlooks by April, only to revise their expectations upward again in May following the TTO announcement.
Well-known economists also participated in the cycle of sharp revisions. We witnessed huge swings in their recession odds—from extremely low at the start of the year, to near or above 50-50 during the April “liberation day” tariff news, and back down to average levels comfortably below 50% as midyear approached.
We see little value in these rapid, whiplash-like shifts in short-term forecasting. How are such swings helpful? In fact, they could be detrimental, potentially leading to extreme shifts in investor allocations and exposing portfolios to the emotional and financial strain of riding a roller coaster of constantly shifting outlooks.
A Look at the Upcoming Crystal Ball
We are quickly approaching the mid-year break, and we’re preparing our Crystal Ball outlook, where we’ll outline expectations for the year-end and the next 12 months. As always, our conclusions are guided by trends in the FVTs, which drive our still cautiously positive view— peppered with expectations for continued volatility.
In our base case scenario, we still look for double-digit returns over the next 12 months, though we also expect intermittent, sizable pullbacks driven by policy rhetoric. Unlike some peer firms, we have not repeatedly revised and re-revised our outlook this year. We view that approach as unproductive, as the FVTs have remained neutral to positive throughout.
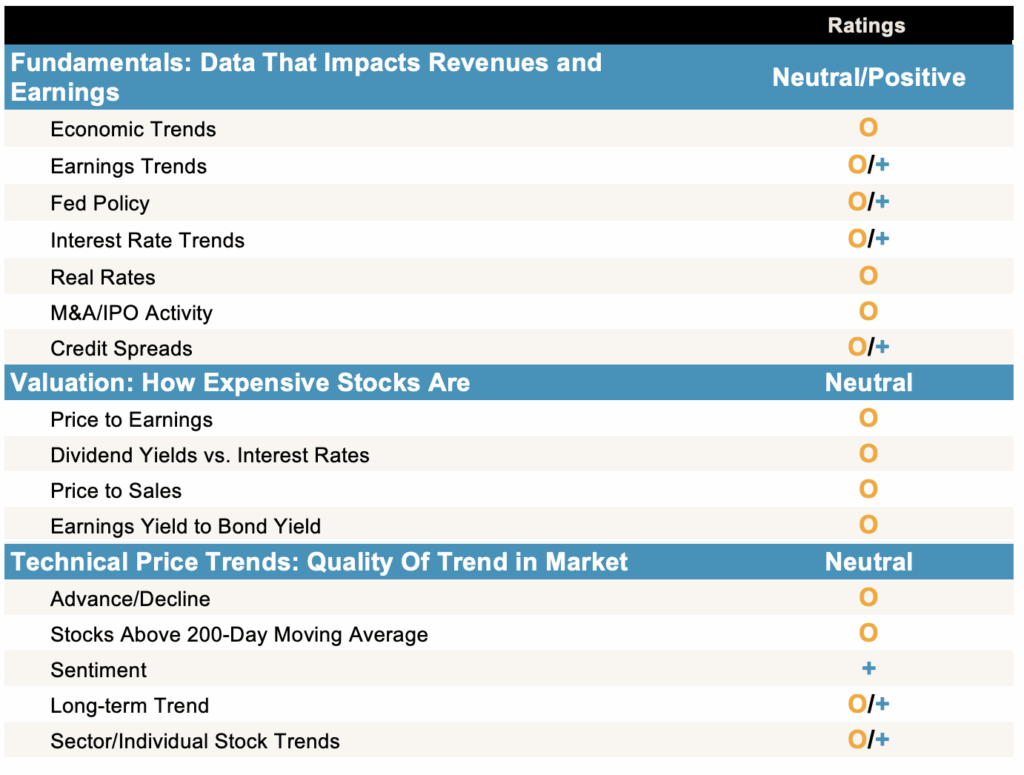
Source: Mariner Investment Team, as of: 5/31/2025. The metrics are rated as positive, neutral or negative based solely on the firm’s interpretation of market data, are subject to change at the firm’s discretion with no notice to you. They are not a guarantee of future results are they are presented for information purposes only.
The most recent inflation data has been surprisingly upbeat, with May’s personal consumption expenditure (PCE) price readings coming in better than expected. First-quarter earnings were strong, growing at a 12% pace5, and second-quarter real GDP growth is forecast to fall between 2% and 3.8%, depending on the model used.6
In short, the soft data appears to be recovering, while the hard data remains resilient. Given that backdrop, we view fundamentals as neutral to positive—not too shabby.
Similarly, valuation is neutral. The S&P 500’s forward P/E ratio has returned to about 22 times earnings—roughly the level seen entering 2025—as confidence has recovered from the April lows. While the P/E ratios of the “Mag 7” stocks once again look somewhat elevated after the recent rally, the average stock appears reasonably valued, with the equal-weighted S&P 500 trading at around 17 times earnings.7 Things look OK on this metric.
Source: Strategas, 5/19/25
Source: FactSet, 6/2/25
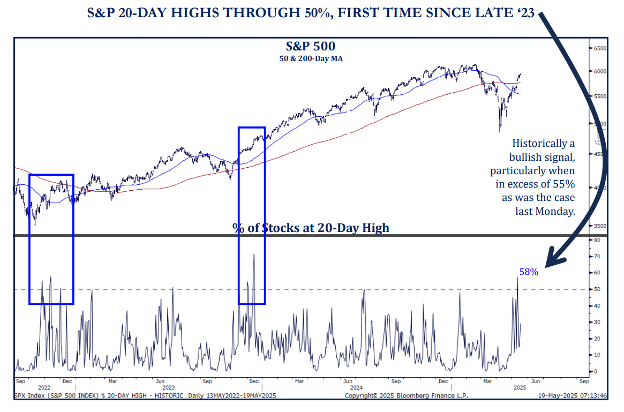
Finally, regarding technical metrics, investor sentiment has improved from the April lows, but it remains broadly bearish—a contrarian positive. On the technical front, while the strength of the recent rally has left some stocks looking temporarily overbought, the underlying momentum appears far more constructive than it did 30 to 45 days ago.
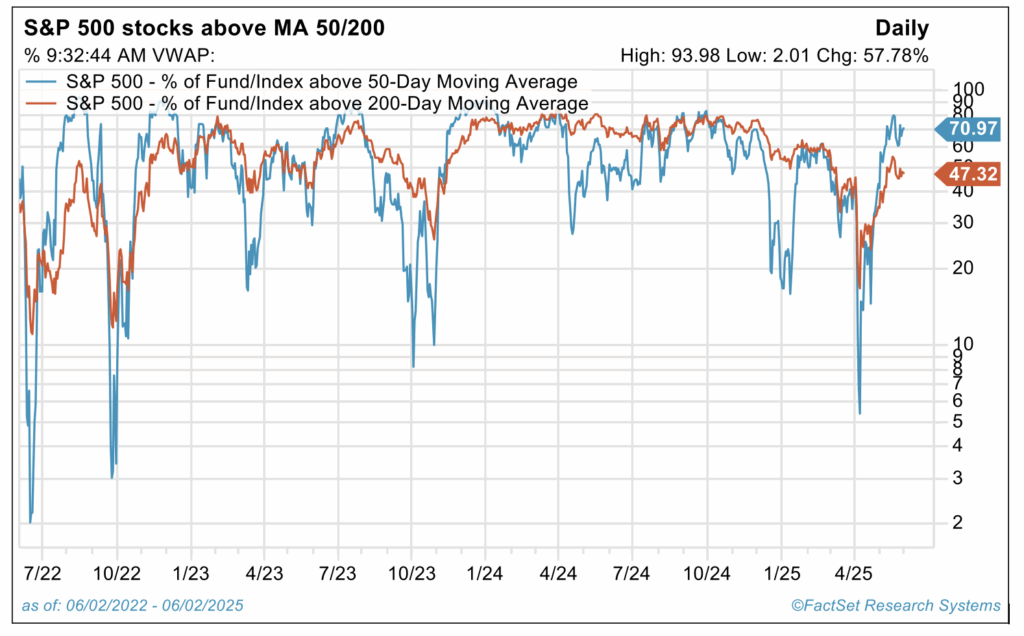
Notably, there has been a significant increase in the percentage of stocks hitting new 20-day highs, as well as those trading above their 50-day and 200-day moving averages. This breadth signals stronger support for the market in the post-TTO environment.
In summary, the technical mosaic is neutral/positive.
FVT’s Solid but Policy Risks Cloud the Picture
It’s this collage of FVT data that inspired us to embrace the wisdom expressed in the Jimi Hendrix quote. The FVT fact set, overall, is neutral to slightly positive—as it often is. In addition, our crystal ball assumptions we outlined back in January remain intact: slow and steady economic growth, stable interest rates at healthy levels, solid earnings performance, and modest Federal Reserve rate cuts expected sometime this year. When those assumptions hold and the FVTs lean neutral to positive, we remain appropriately constructive.
However, we must note that policy risks remain significant (and higher than most investors anticipated going into 2025) and could impact the FVT picture. They are largely centered around two types of risk:
- Those associated with extreme policy rhetoric, or mere threats of action, and/or
- Those that result in actual significant changes in policy direction, approved legislation, or Supreme Court precedent.
Type 1 risks can cause P/E volatility that merely drives elevated temporary price swings (a.k.a. “Clear Air Turbulence”), not more permanent shifts in market trend. Type 2 risks can impact the critical fundamental assumptions that underpin our outlook—to the upside or the downside.
It would be presumptuous to believe that anyone can accurately predict how these risks will evolve. In today’s complex environment, we believe it’s best to channel Jimi Hendrix: listen to the data rather than assume you already know the outcome.
Be neutral, be balanced, be diversified, be ready. That’s our objective in today’s market.
Being Balanced, Diversified, Ready—and Holding Steady—Doesn’t Mean Status Quo
- Reduce Imbalances. At the asset allocation level, we’ve discussed the importance of having a blend of growth and value stocks in one’s portfolio. After years of outperformance, areas of the market more exposed to growth companies in tech may be playing an outsized role in your portfolio. The group of “Mag 7” stocks underperformed the broader index during the “liberation day” sell off, yet surged well above index returns in the recover, highlighting the elevated price volatility and risk that comes with overexposure.
- Consider International Equities. We’ve encouraged clients to consider some exposure to international stocks if they have been hesitant until now, especially following the dramatic outperformance in domestic large-cap equities that we’ve seen over the last several years.
- Recognizing Investor Preferences and Objectives. Finally, our message to “hold steady” at your normal equity allocation target remains unchanged and prudent for most. But that doesn’t mean doing nothing.
For those who are very patient, long-term investors, buying on dips may be appropriate. On the other hand, if this 20% rally has taken you back to above normal allocation levels—and the liberation day 20% swoon was too uncomfortable for you—your initial targeted equity allocation may have been too high. In that case, a permanent reduction in your target allocation could be worth considering. Talk to your wealth advisor about this.
Wrap-Up
We are looking forward to sharing our formal second-half outlook in the upcoming July Crystal Ball update. Our base case for 2025—calling for double-digit returns—remains unchanged. We’re slightly lowering the probability of that outcome and acknowledge that the range of potential upside and downside outcomes is now a bit wider than originally projected, but these are only modest tweaks to our view.
Stay tuned and thanks for your confidence.
Sources:
1-5, 7FactSet
6New York Fed https://www.newyorkfed.org/research/policy/nowcast#/nowcast and Atlanta Fed https://www.atlantafed.org/cqer/research/gdpnow
Disclosures:
This commentary is provided for informational and educational purposes only. As such, the information contained herein is not intended and should not be construed as individualized advice or recommendation of any kind.
The opinions and forward-looking statements expressed herein are not guarantees of any future performance and actual results or developments may differ materially from those projected. The information provided herein is believed to be reliable, but we do not guarantee accuracy, timeliness, or completeness. It is provided “as is” without any express or implied warranties.
Diversification is an investment strategy designed to help manage risk, but it does not ensure a profit or protect against loss in a declining market.
Equity securities are subject to price fluctuation and investments made in small and mid-cap companies generally involve a higher degree of risk and volatility than investments in large-cap companies. International securities are generally subject to increased risks, including currency fluctuations and social, economic, and political uncertainties, which could increase volatility. These risks are magnified in emerging markets.
Fixed-income securities are subject to loss of principal during periods of rising interest rates and are subject to various other risks including changes in credit quality, market valuations, liquidity, prepayments, early redemption, corporate events, tax ramifications, and other factors before investing. Interest rates and bond prices tend to move in opposite directions. When interest rates fall, bond prices typically rise, and conversely, when interest rates rise, bond prices typically fall.
There is no assurance that any investment, plan, or strategy will be successful. Investing involves risk, including the possible loss of principal. Past performance does not guarantee future results, and nothing herein should be interpreted as an indication of future performance. Please consult your financial professional before making any investment or financial decisions.
The S&P 500 is a capitalization-weighted index designed to measure the performance of the broad domestic economy through changes in the aggregate market value of 500 stocks representing all major industries. S&P 500 Equal Weight Index is designed to track the equally weighted performance of the 500 constituents in the S&P 500 Index. The indexes referenced herein are unmanaged and cannot be directly invested in.
Mag 7 stocks refer to Alphabet, Amazon, Apple, Meta, Microsoft, Nvidia and Tesla.
Investment advisory services are offered through Investment Adviser Representatives (“IARs”) registered with Mariner Independent Advisor Network (“MIAN”) or Mariner Platform Solutions (“MPS”), each an SEC registered investment adviser. These IARs generally have their own business entities with trade names, logos, and websites that they use in marketing the services they provide through the Firm. Such business entities are generally owned by one or more IARs of the Firm, not the Firm itself. For additional information about MIAN or MPS, including fees and services, please contact MIAN/MPS or refer to each entity’s Form ADV Part 2A, which is available on the Investment Adviser Public Disclosure website (www.adviserinfo.sec.gov). Registration of an investment adviser does not imply a certain level of skill or training.
Material prepared by MIAN and MPS.